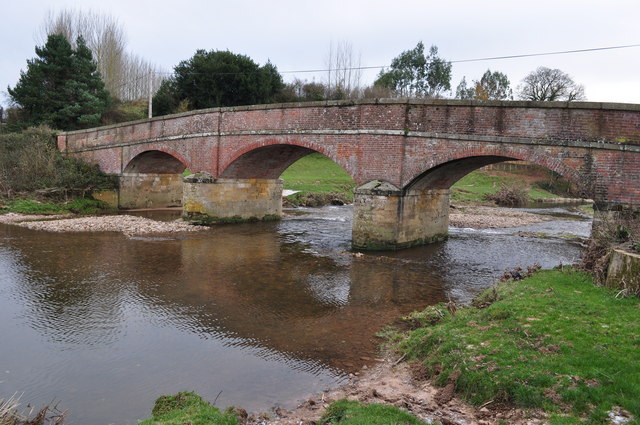
The county has the highest number of substandard bridges in the UK
Devon has the highest number of substandard bridges at 244, followed by Essex (167), Somerset (160) and Cornwall (140).
But Cllr Stuart Hughes, Devon County Council’s Cabinet Member for Highway Management, said that the term ‘substandard’ does not mean there is a problem with the bridge, and that the county is responsible for more bridges that any other authority in the UK.
The number of ‘substandard bridges’ has also reduce from 249 to 244 over the last year, as the county are responsible for 2,712 highway bridges, just over nine per cent are unable to withstand a 40 tonne load.
He added: “Devon County Council is responsible for more bridges than any other authority in the UK and we’re recognised as one of the UK’s leading authorities in structures asset management.
“The term ‘substandard’ does not mean there is a problem with the bridge, it means we are managing 244 bridges that cannot carry the full 40 tonnes ‘standard’ highway load. Ninety of these are ‘clapper’ bridges on Dartmoor National Park, which are performing well, and the remainder are either scheduled for strengthening work or have a weight limit.
“Those with weight limits are suitable for the road they are on, such as small lanes where large vehicles are unlikely to require access. We manage our bridge stock effectively in accordance with national guidelines to maintain the safety of the public.”
Devon County Council was allocated a record-breaking £18.75m for road maintenance by the Chancellor in the Budget, and Cllr Hughes added: “We’ll be investing more than £8m in maintenance of our structures this year, with some of that funded from the £18.75m we’ve received from Central Government.”
Nationwide, around 4.4 per cent of bridges are considered substandard.
The ten councils in Britain with the highest number of substandard bridges are:
| Local Authority | Number of bridges* | Number of substandard bridges | Proportion of substandard bridges |
| Devon | 2,712 | 244 | 9% |
| Essex | 910 | 167 | 18% |
| Somerset | 1,483 | 160 | 11% |
| Cornwall | 1,007 | 140 | 14% |
| Suffolk | 924 | 140 | 15% |
| Northumberland | 972 | 80 | 8% |
| Lancashire | 1,469 | 77 | 5% |
| Cumbria | 1,911 | 71 | 4% |
| Gloucestershire | 962 | 66 | 7% |
| Aberdeenshire | 1,293 | 65 | 5% |
The ten councils in Britain with the highest proportion of substandard bridges are:
| Local Authority | Number of bridges | Number of substandard bridges | Proportion of substandard bridges |
| Lewisham | 34 | 18 | 53% |
| Hammersmith and Fulham | 4 | 2 | 50% |
| Blackpool | 21 | 9 | 43% |
| Bristol | 140 | 52 | 37% |
| Islington | 7 | 2 | 29% |
| Southend-on-Sea | 83 | 22 | 27% |
| Kensington and Chelsea | 4 | 1 | 25% |
| Barking and Dagenham | 13 | 3 | 23% |
| Bexley | 82 | 18 | 22% |
| Conwy | 291 | 63 | 22% |
RAC Foundation director Steve Gooding said establishing the condition of highway bridges is a “litmus test for the condition of our road network” and described the findings as “worrying”.
He went on: “While we should draw some comfort from the good knowledge highway authorities have about the strength and structural integrity of their bridges, the fact is that many thousands are subject to enhanced monitoring, speed and weight restrictions, and the cost of bringing them up to scratch is continuing to mount.
“Ancient bridges on rural back roads might not be the highest priority for repair, but the risk we run is that substandard structures on some roads result in heavier vehicles having to make lengthy detours.”
 Students connect with elderly residents to combat loneliness
 Crackdown on anti-social behaviour in Plymouth
 £1.6 million for more energy efficiency Devon home upgrades
 SWW to build huge new Churston solar farm
 MP highlights Devon's dentistry 'crisis'
 Work on ‘once-in-a-generation’ Newton Abbot project back on track
